Tessera keeps the record and runs the service desk.
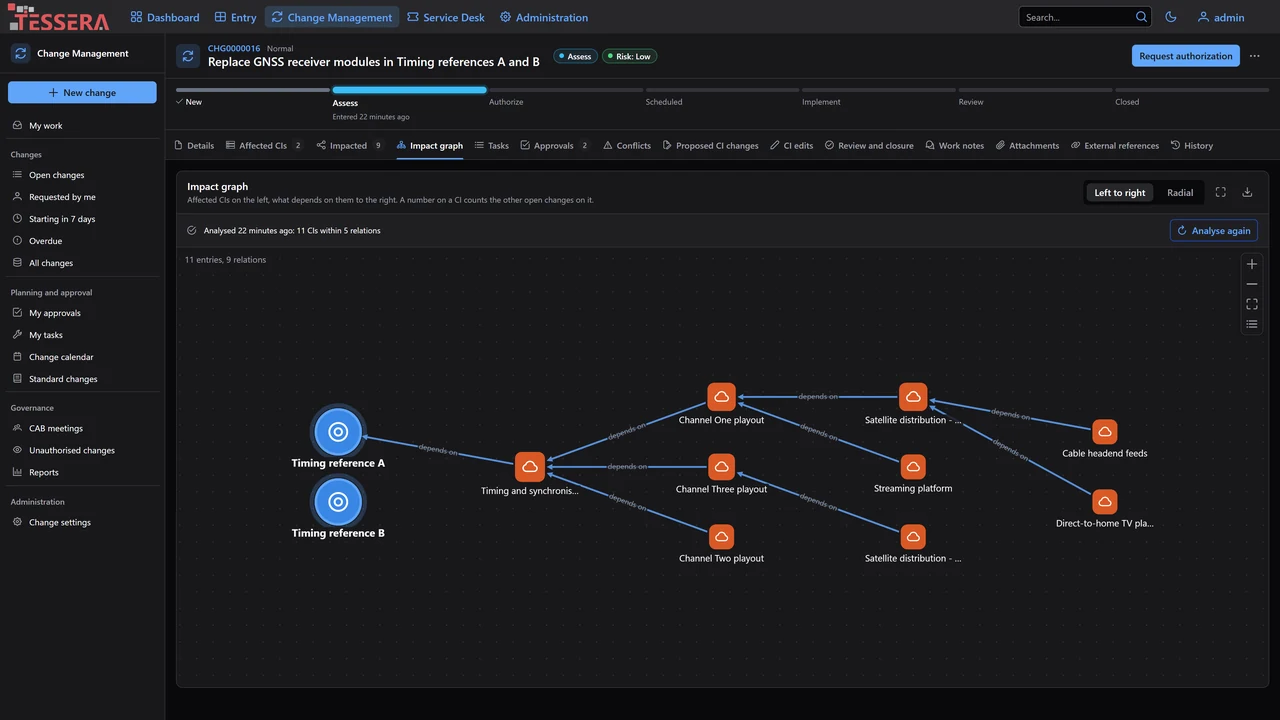
Equipment, ownership and dependencies sit in a configurable CMDB, with change management and ticketing on top. Monitoring alerts can open incidents through its alert API.
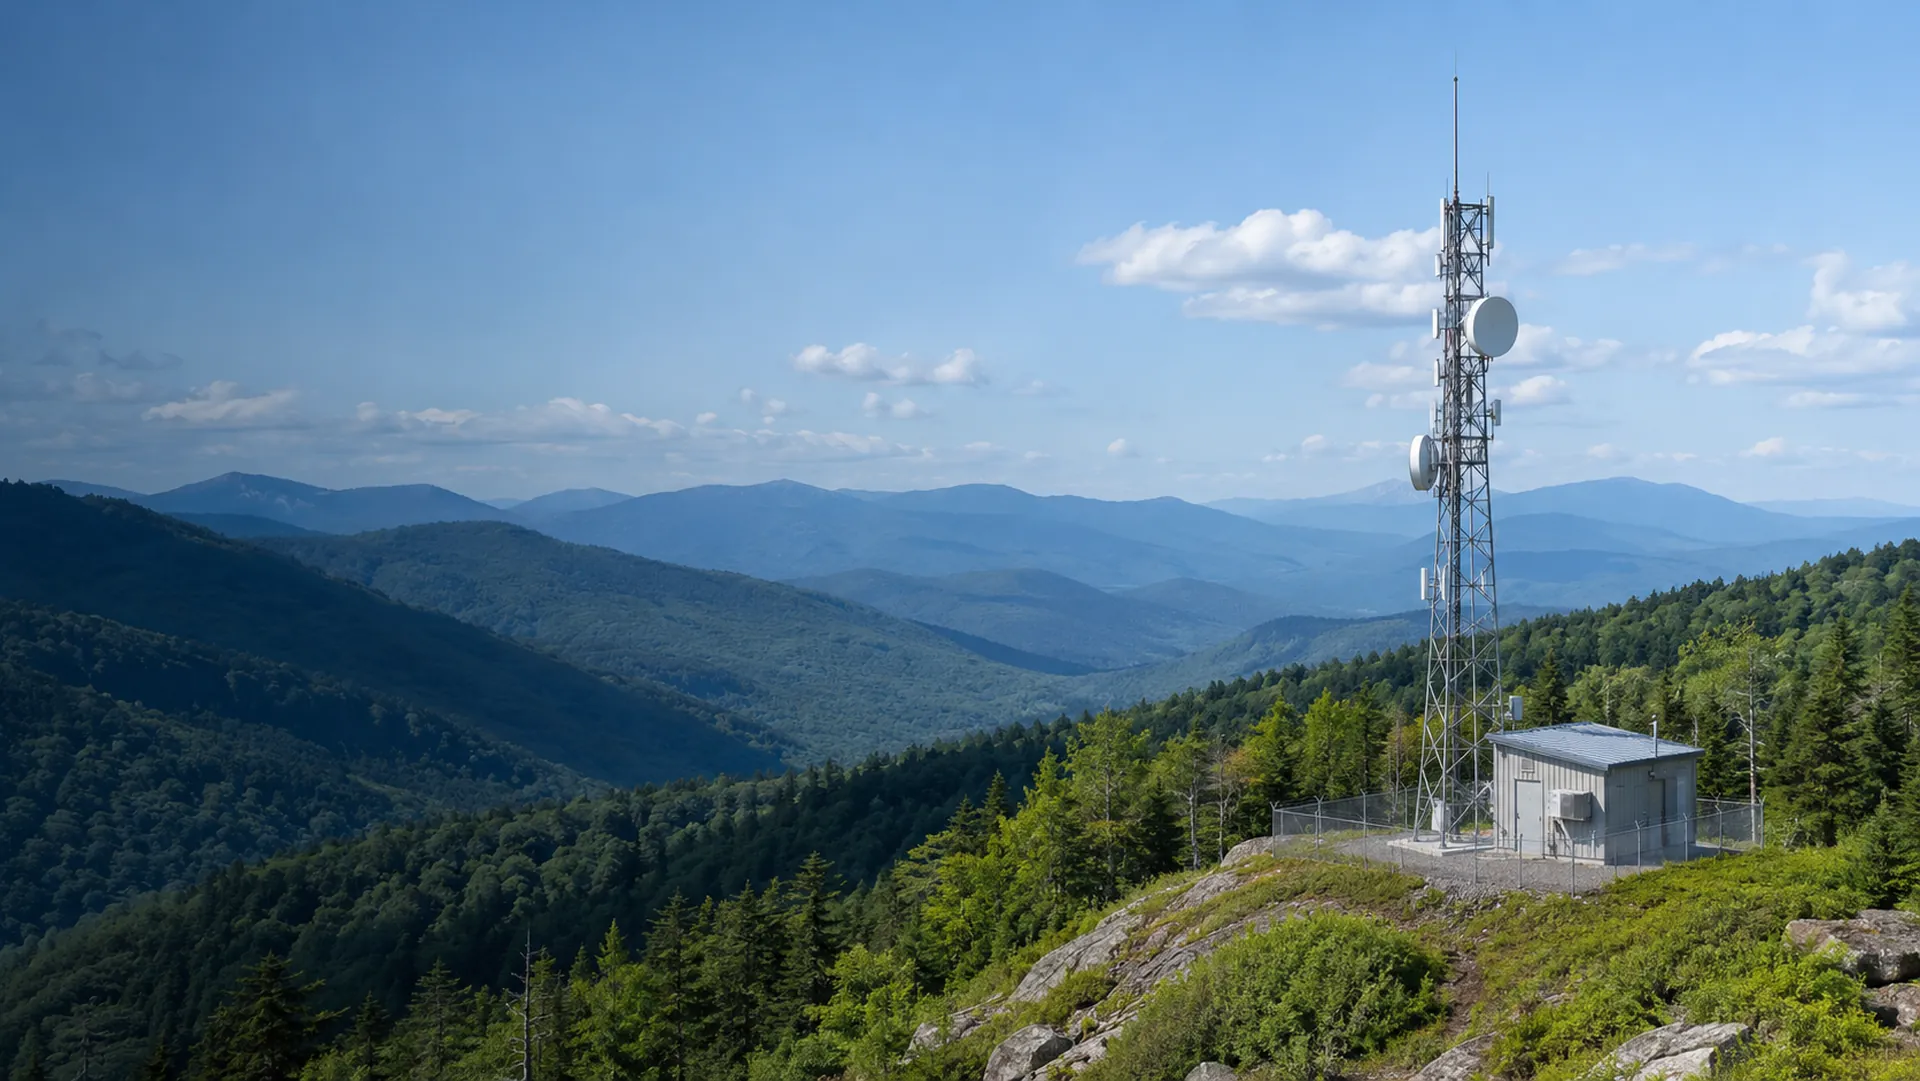
Three platforms for broadcast operations and critical infrastructure. Start with the one you need, and connect the others as you grow.
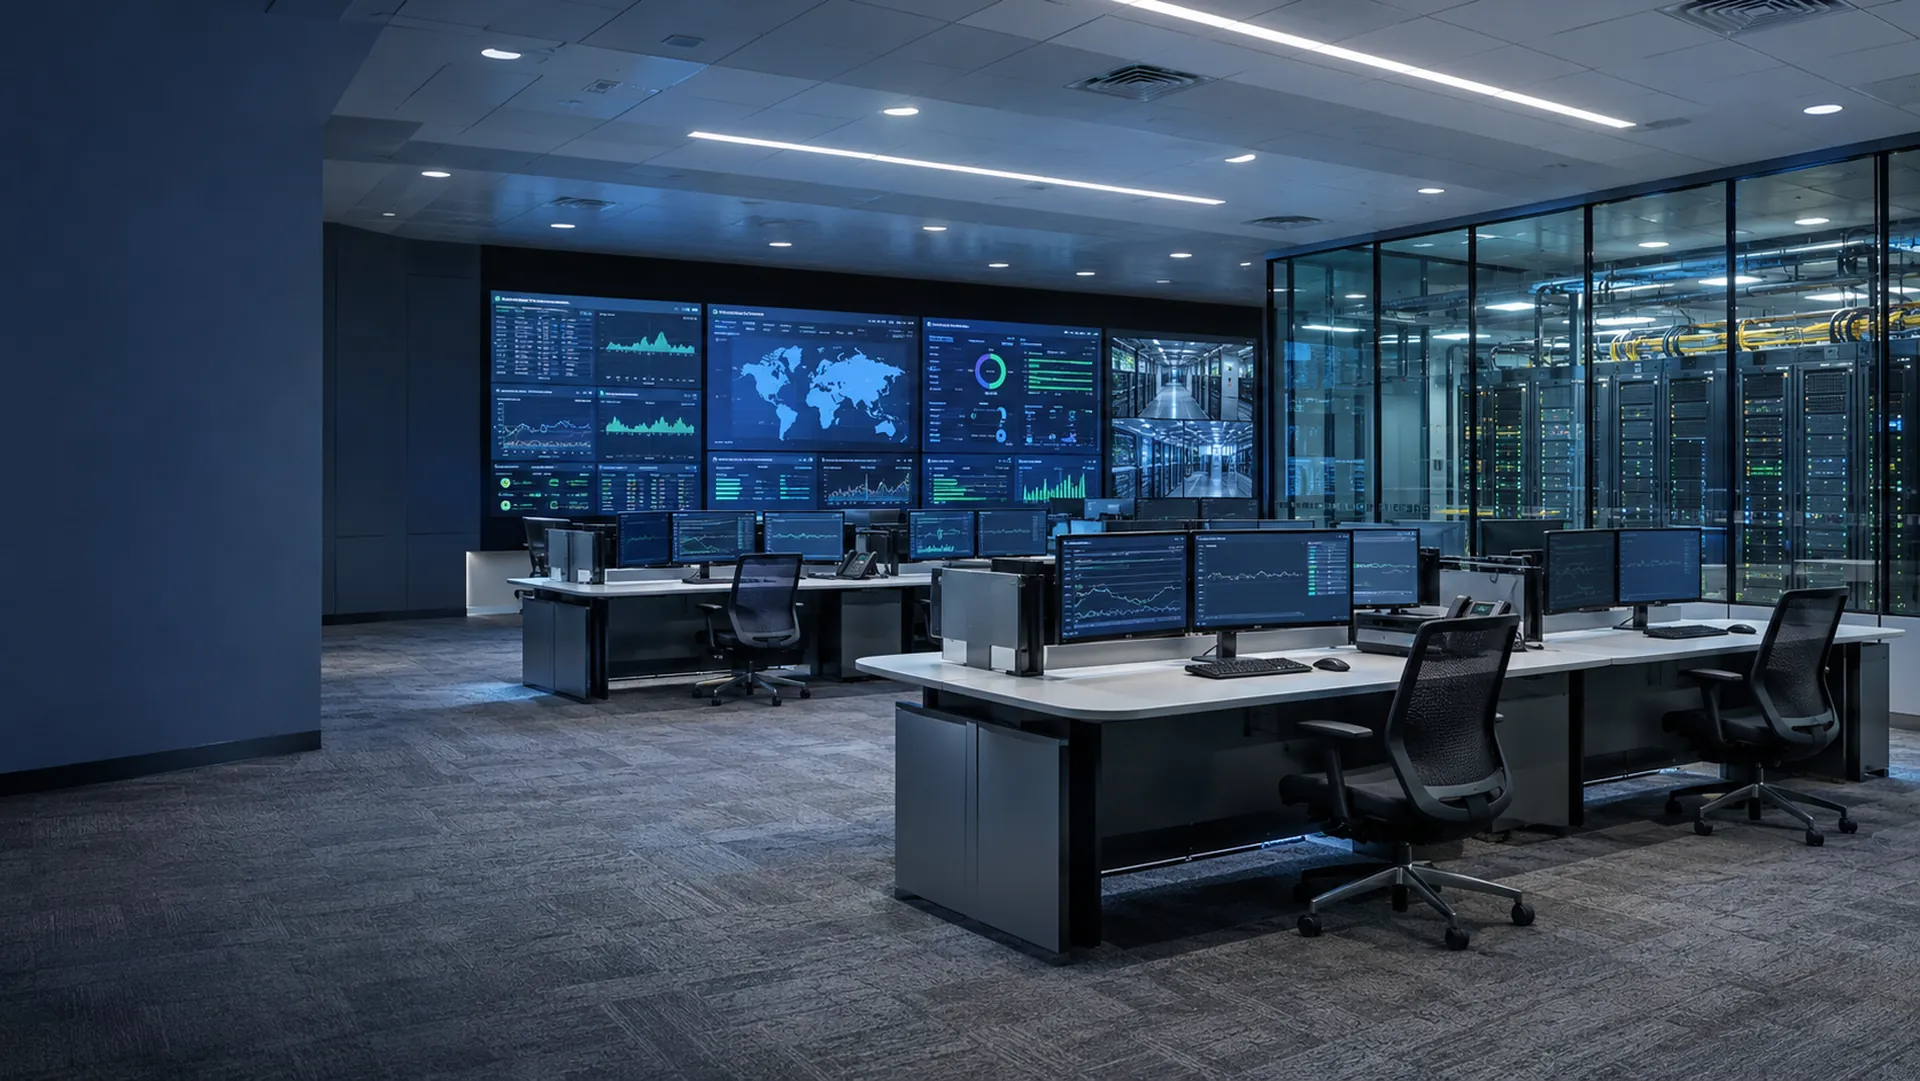
Monitor and control your end-to-end network from one place, whatever the hardware, vendor, protocol or location. Mosaic is a flexible NMS/OSS: rules cut alarm noise, status rolls up so you can trace a fault to its source, and a backup server can take over on its own.
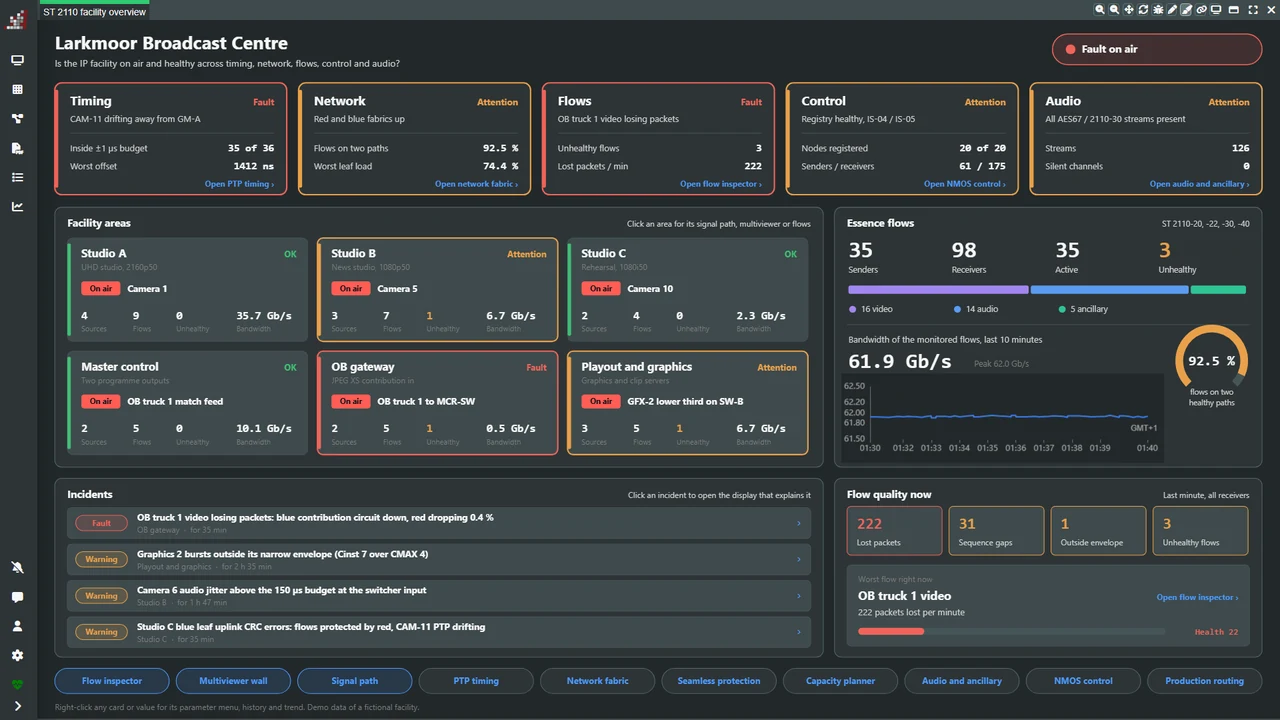
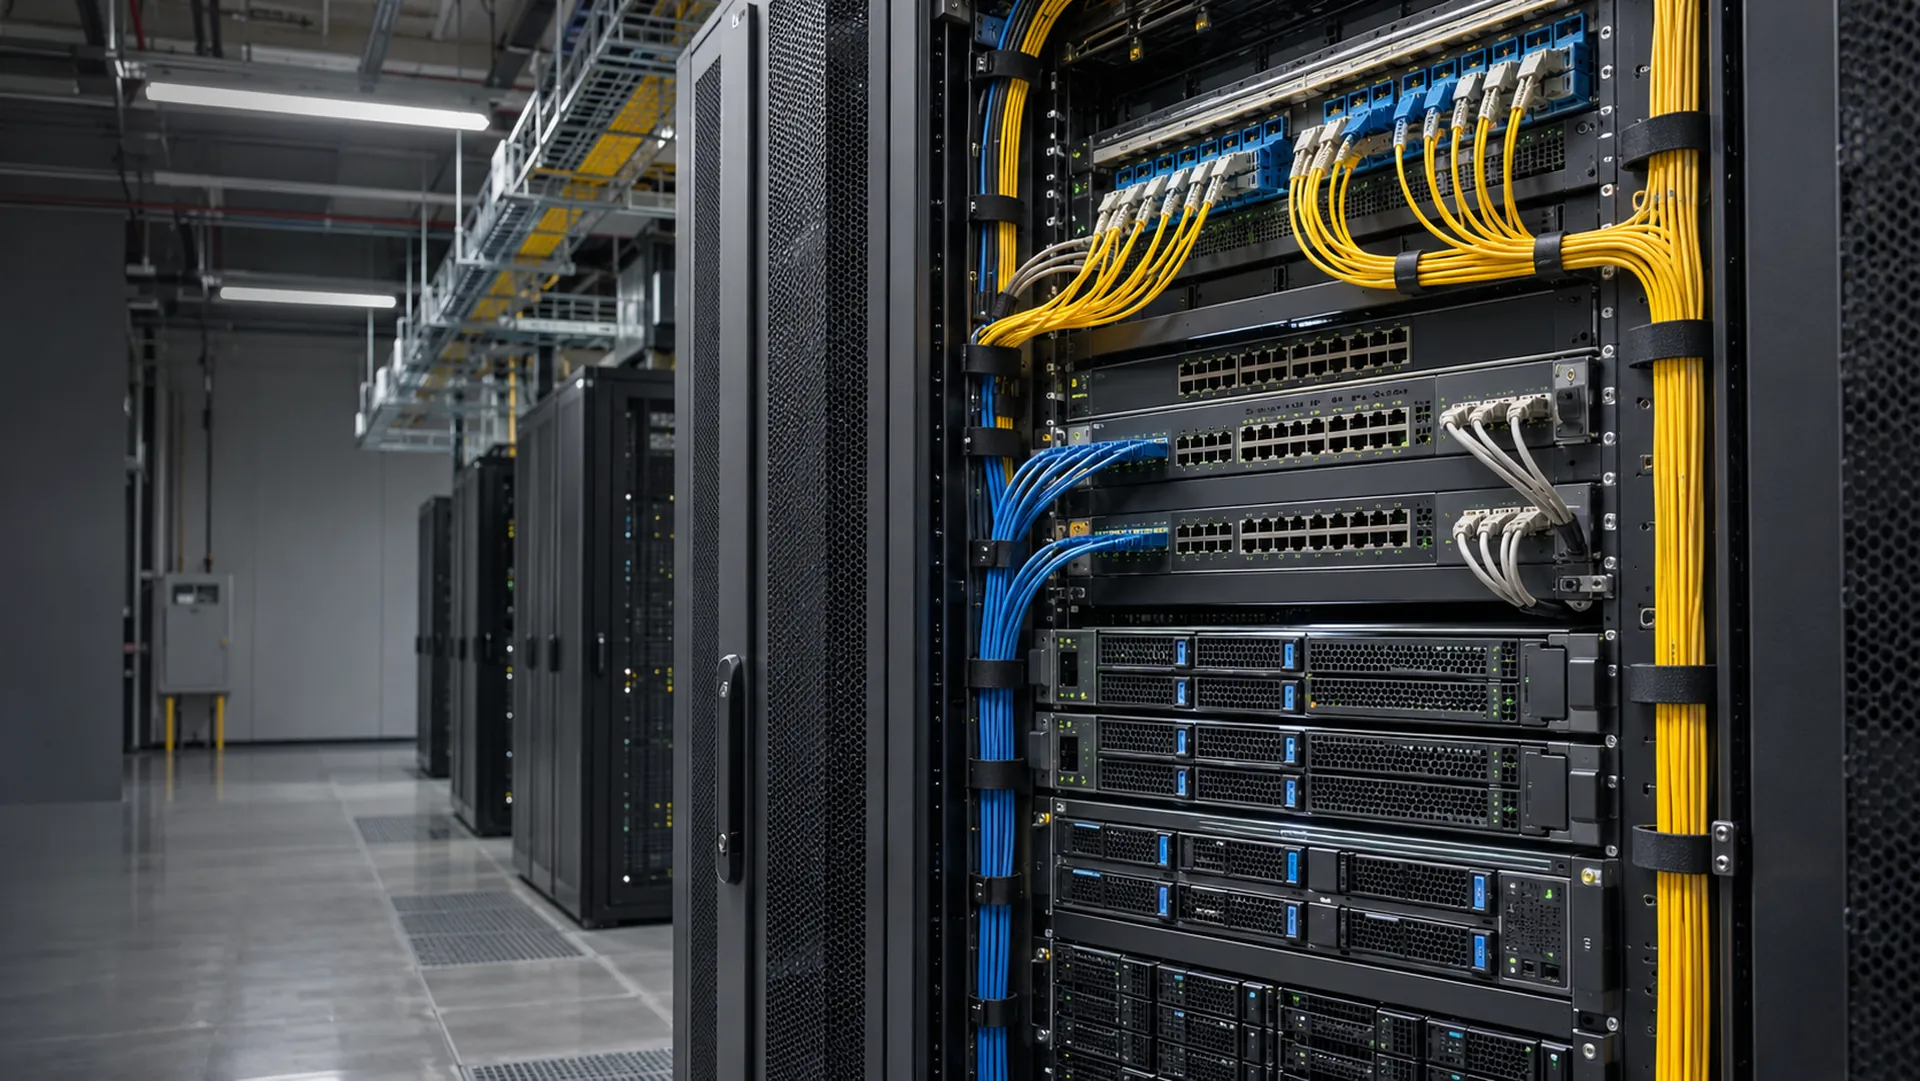
Service management built on a CMDB you define. Know what you run, control what changes and fix what breaks, with change management and ticketing on top of your asset records.
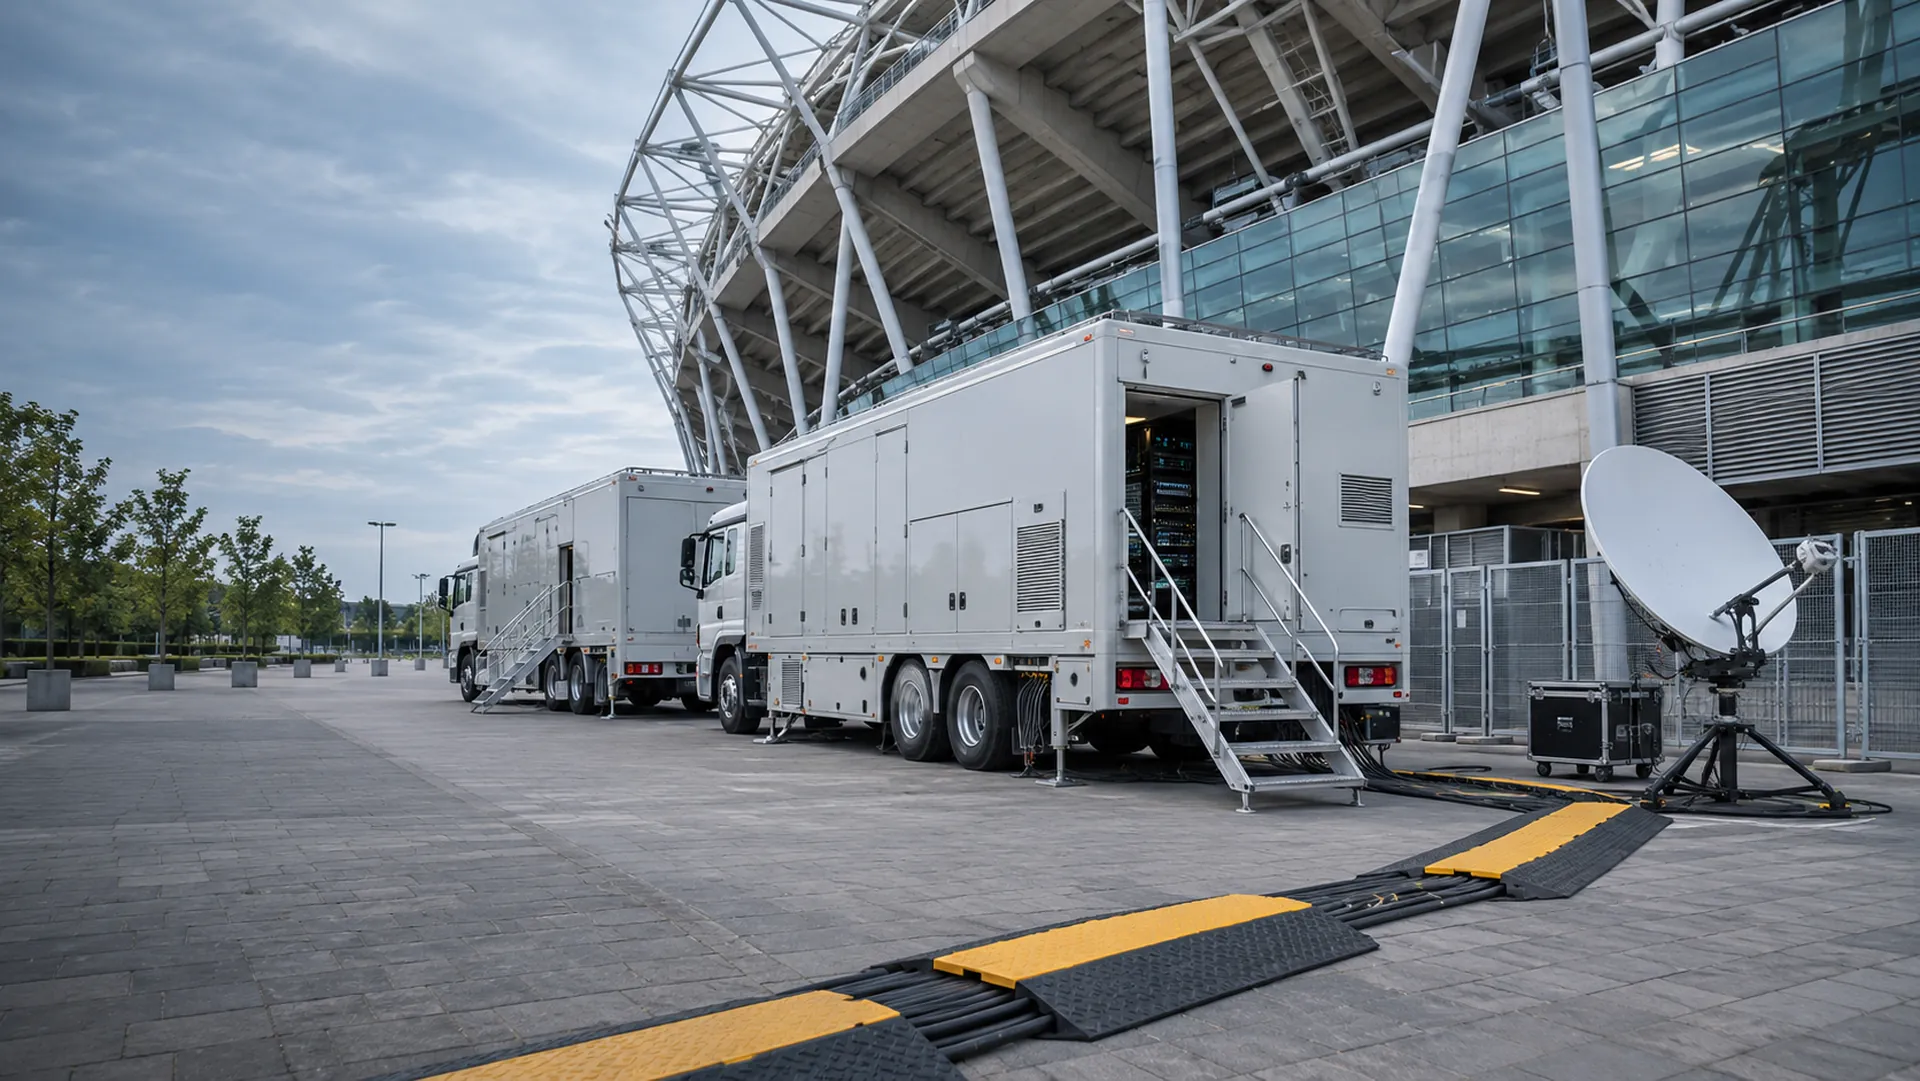
Schedule live events, book the equipment each one needs by what it can do, and run them as workflows. Assemble workflows visually from ready-made tasks, and script new ones in Groovy when you need to.
Each platform does a different job. This is how to tell them apart.
| Mosaic | Tessera | Tapestry | |
|---|---|---|---|
| The question it answers | What is happening on my network, and what do I do about it? | What do we have, what will this change touch, and who is fixing what broke? | What does this event need, and is it healthy on air? |
| Built for | Operators of mission-critical systems, across all markets | Broadcast, media and IT teams | Sports and event broadcasters, REMI centers and distribution teams |
| What it does | Monitors and controls any device, with alarms and automation | Keeps a configurable CMDB, with change management and ticketing on top | Connects event schedules, resource allocation and live workflows |
| Where you work | Customizable views in a desktop client and a web client | Configurable grids and calendars, an agent workspace and a requester portal | A visual Thread editor and a live operations console |
| How you extend it | Documented extension points and an integrated driver editor | A documented REST API, signed webhooks and CSV import | Groovy tasks, YAML workflow definitions and Mosaic drivers |
Each one holds a different part of the operation. Scope the data exchanges and integrations you need for the platforms you select.
Equipment, ownership and dependencies sit in a configurable CMDB, with change management and ticketing on top. Monitoring alerts can open incidents through its alert API.
Mosaic monitors and controls the equipment. Its device layer also serves Tapestry, whose live operations console shows Mosaic warnings.
Tapestry coordinates live broadcast workflows and resources from the schedule to the signal.