IT infrastructure monitoring
Networks, servers and the data hall in one view, with alarms traced to the root cause and what else it affects.
See networks and data centers as one.
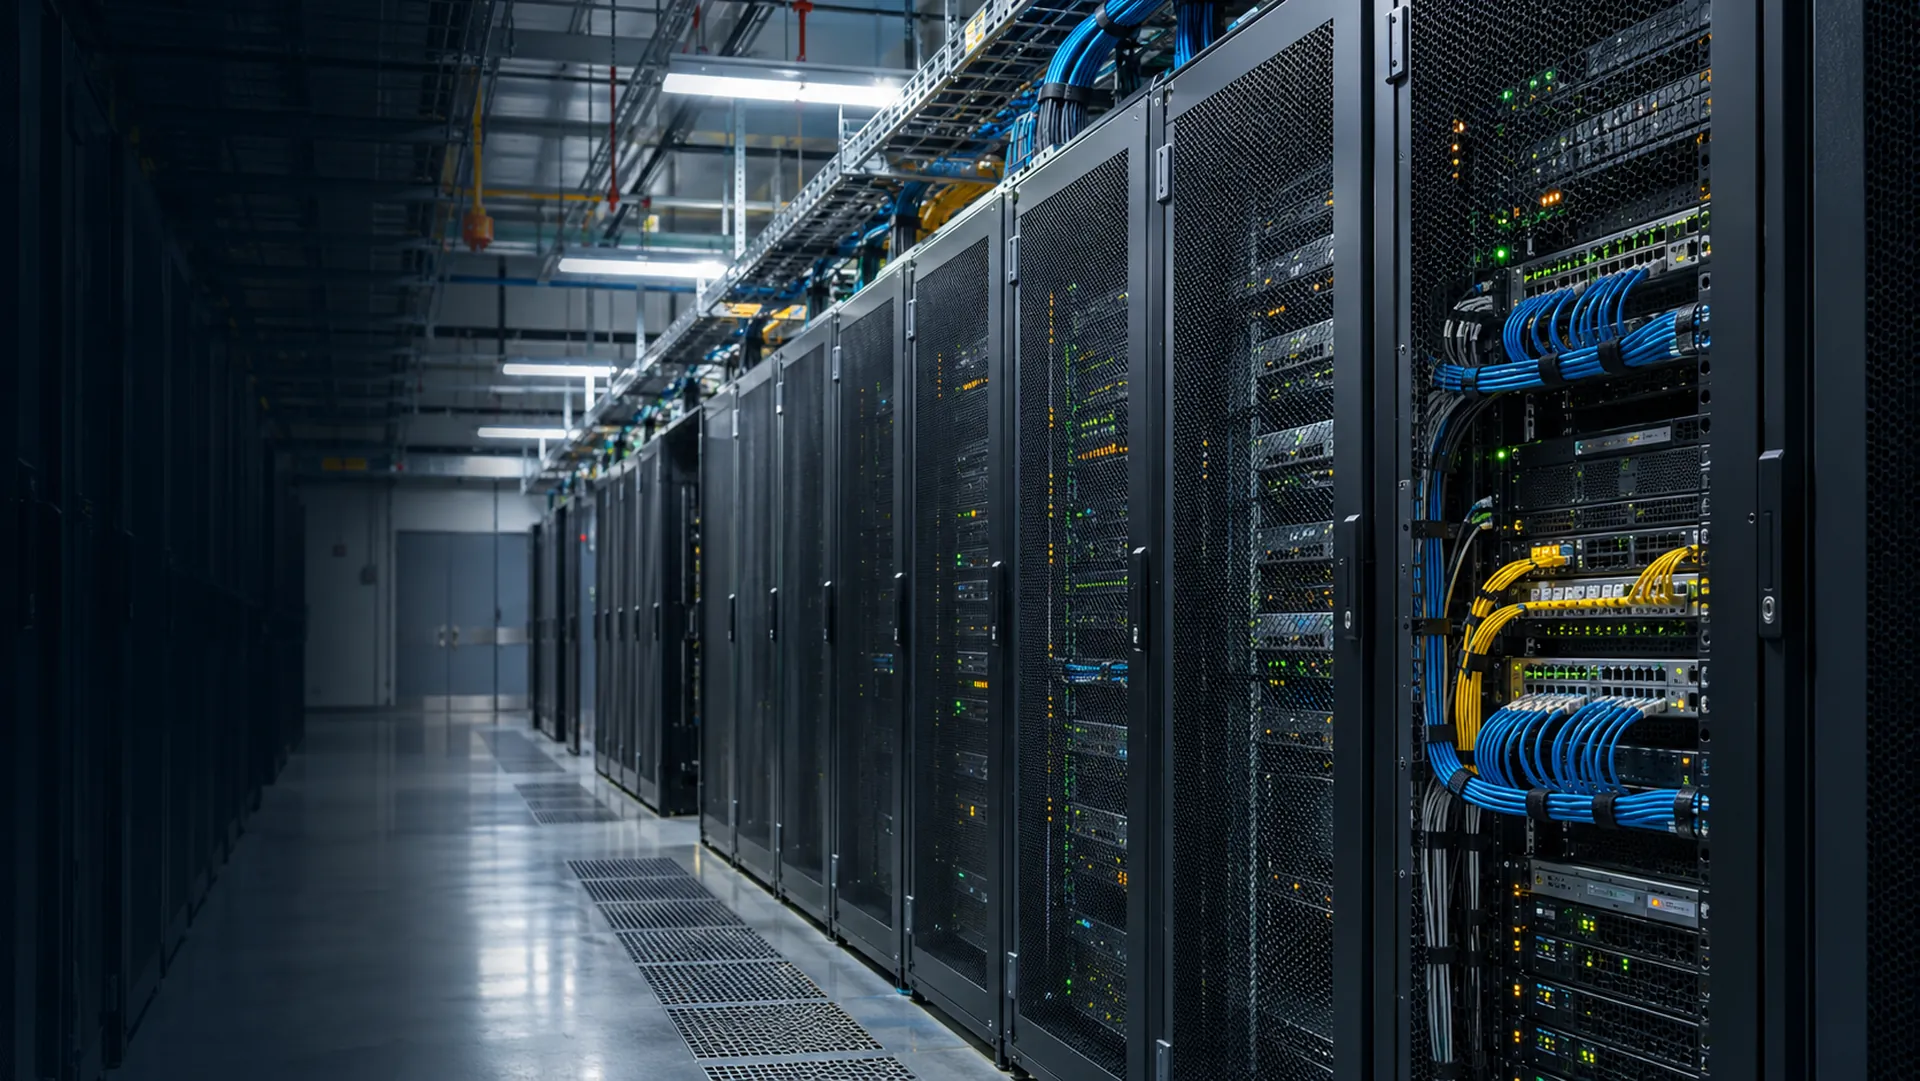
In a data center, one failed cooling fan can set off alerts across a row of racks.
Correlating those alerts and mapping dependencies shows your team the root cause, and what else it affects.
Networks.Servers.Applications.
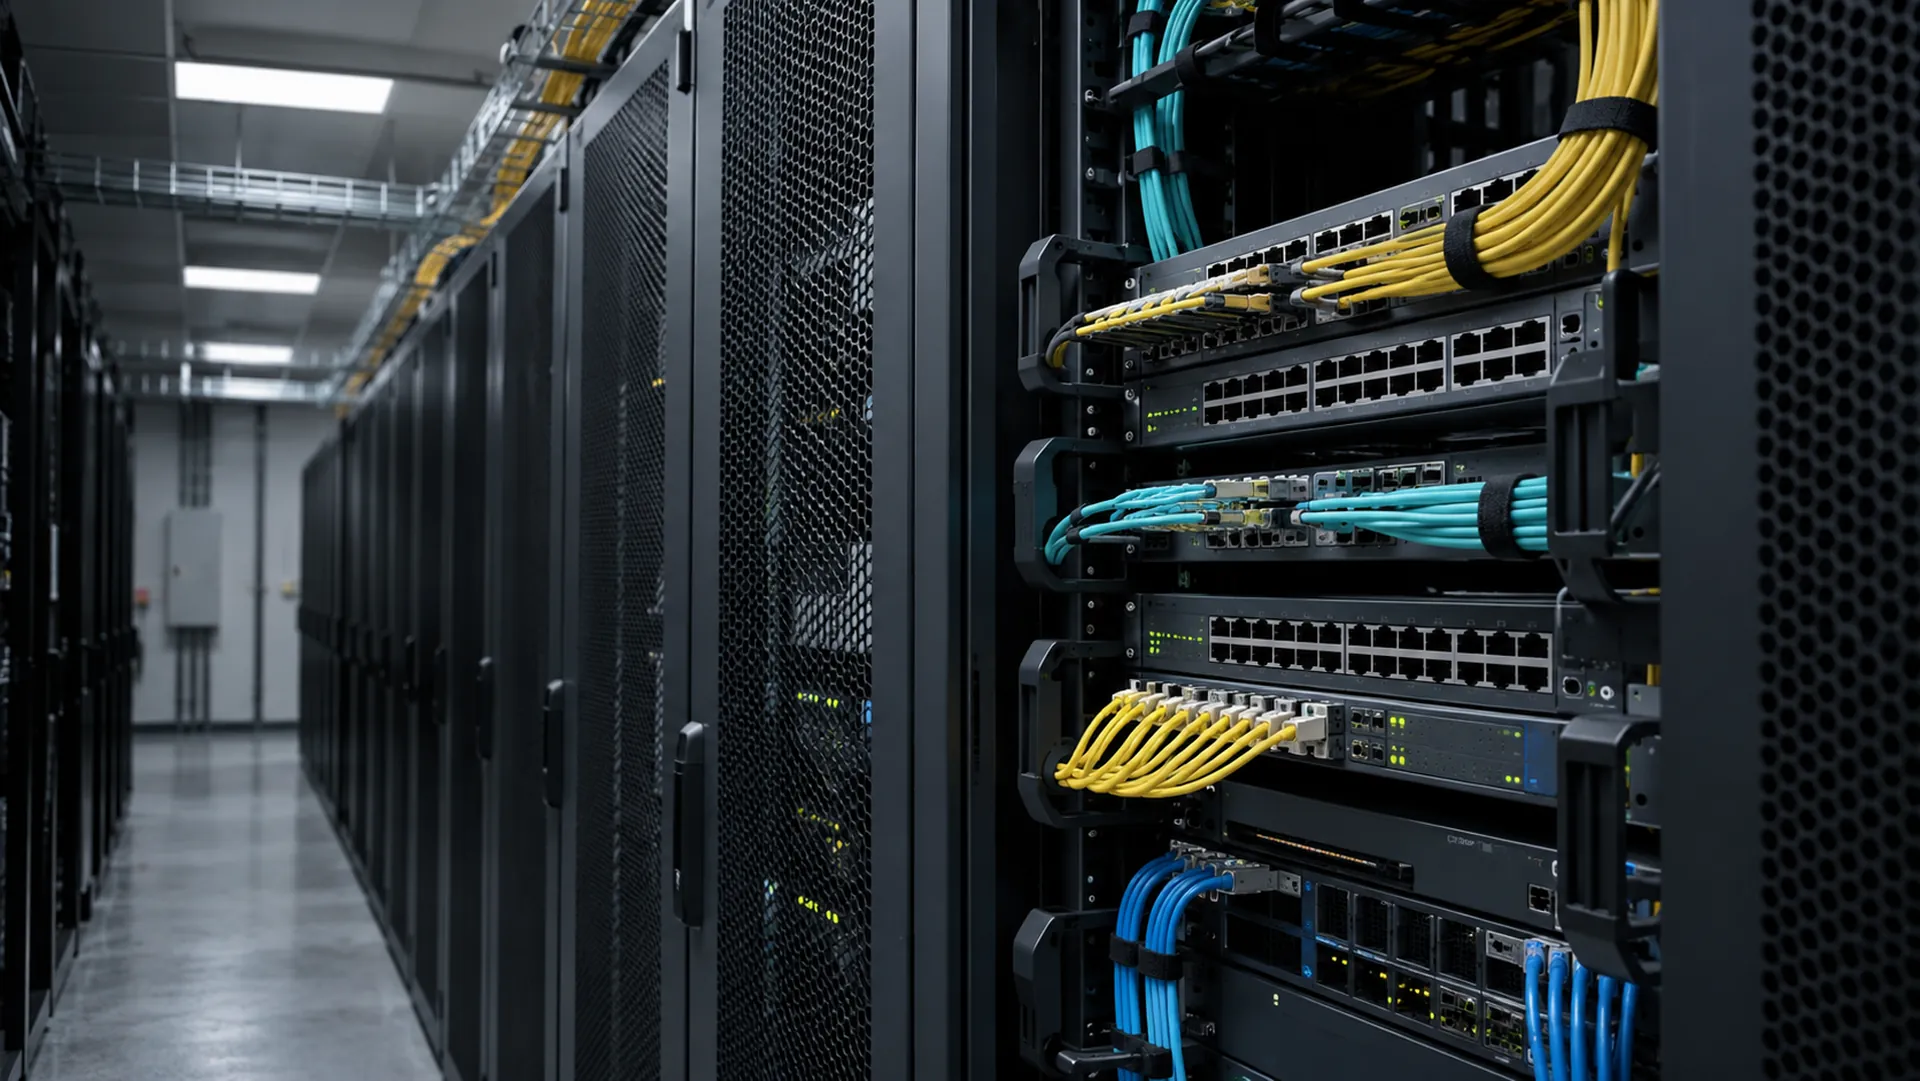
See the whole route, not just the far end.
Complete visibility across the network let one technology group improve response times by 80% and address issues before they spread.
- 80%
- Faster response
- 99.8%
- Uptime
- 5K+
- Devices
Enterprise Technology Group
Network, security and automation, in one console.
From the switch port to the cooling unit.
Network monitoring
Real-time monitoring of network devices, servers and applications, with alerting and performance analytics. Switch ports, servers and the cooling units beside them sit on one data hall view.
Security and compliance
Security monitoring, threat detection and compliance reporting for regulatory requirements. Sign-in through SAML, OIDC or LDAP, about 100 named permissions, encrypted device credentials and scheduled compliance reports.
Automation and orchestration
Automated incident response, workflow orchestration and resource provisioning. Rules and scripts respond to alarms, and events go out through e-mail and HTTP tool chains to your ticketing tools.
What you can do with it.
Find the fault, fix it and report on it, from one console.
Incident management
- Alert correlation
- Root cause analysis
- Automated remediation workflows, from rules and scripts
- Multi-channel notifications, including e-mail and HTTP tool chains
Infrastructure discovery
- Automatic discovery of network devices and services
- Topology mapping and visualization
- Asset inventory and tracking
- Dependency mapping
Performance management
- Real-time performance metrics
- Historical trend analysis
- Capacity planning and forecasting
- SLA monitoring and reporting
Integration and APIs
- REST API for custom integrations, with script-backed endpoints and API keys
- SNMP v3, WMI, SSH, REST and Kubernetes
- Outbound tool chains to ticketing and ITSM tools
- Third-party system connectors
See 1 more screenPlatform health
Common questions
Can it discover my network automatically?
Yes. It discovers and maps network devices, servers and applications.
How does it reduce alert noise?
It correlates alerts and helps find root causes, so your team works on the problem rather than each symptom.
Can it connect to our other systems?
Yes. Mosaic sends events out through e-mail and HTTP tool chains, exposes REST endpoints you define and secure with API keys, and connects to third-party systems. It can also post alerts to the Tessera alert API, which turns repeats into one incident.
What you would use
- MosaicUnified monitoring and control of all IT infrastructure from one view.
- TesseraIT assets as records in a CMDB, with their relationships, changes and tickets, and incidents opened from Mosaic alarms.
- TapestryWorkflows assembled from ready-made tasks, with a recovery plan for every step.